The Central Tendencies
The Central Tendencies

Last modified on 1:03 PM of January 19, 2021
What is a central tendency? In mathematics, central tendency is commonly used in the domain of statistics. A central tendency is "the extent to which statistical values fall around a middle value"[1] .
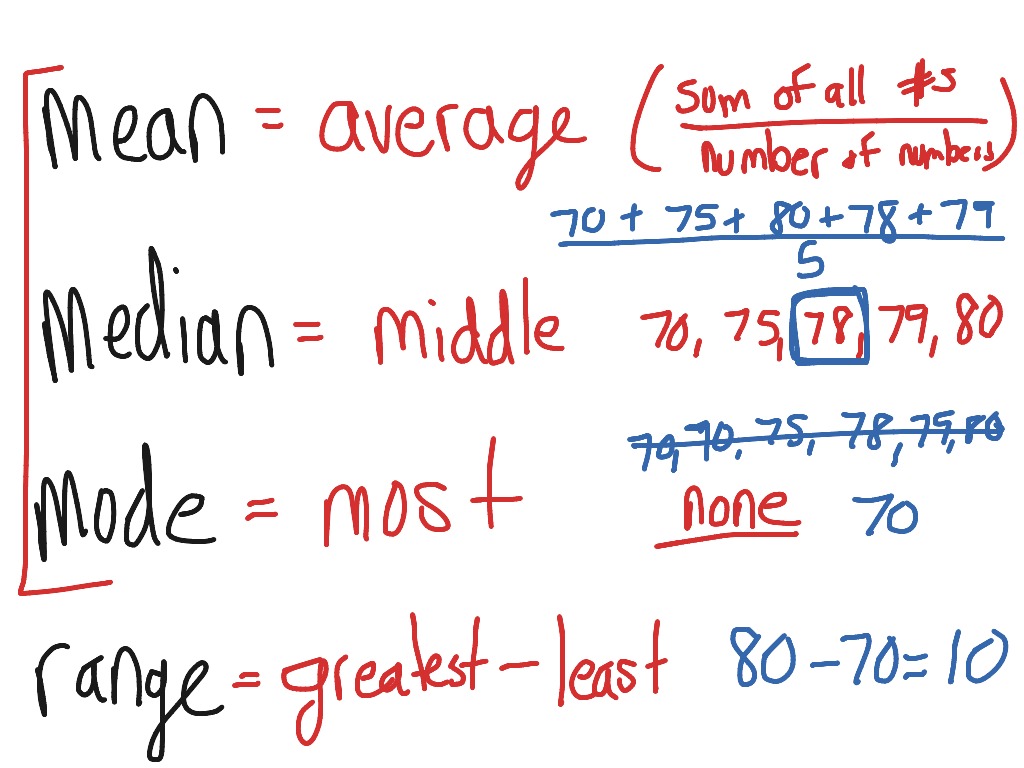
Basically, there are 3 measures of central tendency: the mean, median, and mode. But what do these 3 strange words represent?
- Mean: the mean is the most common measure of central tendency, and it is often referred as the "average". To calculate the mean, we add all the terms of a data set together, then divide it by the amount of terms there are! You can remember this word with "average". Here is an example:
5 random students were asked to reveal their science test marks. The marks were: 100, 97, 95, 92, and 90. To calculate the average, we will first add these values together, so we get 100 + 97 + 95 + 92 + 90 = 474. Now we take the result, and divide it by the amount of values there are, so we get 474/5 = 94.8. Therefore, the mean of this data set is 94.8.
-Median: the median is another measure of central tendency, and it's the midmost number in a data set that is placed in an order from least to greatest. To calculate the median, we arrange the data set from least to greatest. Then, we do the elimination process and find the midmost value. If there is an even amount of terms, when there are two numbers in the middle, we usually find the average/mean of those two numbers, and the result is the median. You can remember this word with "middle". Here is an example:
6 students were surveyed for the amount of pets they owned in the past. The results were: 0, 1, 3, 2, 0, and 12. To calculate the median, we would first arrange the number from least to greatest, so we would end up with 0, 0, 1, 2, 3, and 12. Then, we would do the elimination process, and end up with this: 0, 0, 1, 2, 3, 12. Now that we have 1 and 2 in the middle, we would then calculate the mean, which is (1 + 2)/2, and get 1.5. Therefore, the median of this data set is 1.5
-Mode: the mode is another measure of central tendency, and it is the number that occurs the most in a data set. To find the mode, we count how many times a number occurs in a data set, the number that appears the most is the mode. Sometimes, there are 2 or more modes, because sometimes in a data set, there is not any mode (do not put 0 as the answer if there isn't a mode, because 0 is a number, too). You can remember this word with "most". Here is an example:
Two groups of people were interviewed for their shoe sizes. The first group's results were: 3, 6, 4, 8, 2, and 5. To calculate the mode, we need to find the number that appears the most, but all numbers appear the same amount (once), so there is no mode. The second group's results were: 2, 7, 6, 2, 8, 7, and 9. When we calculate the mode for this group, we find that there are two modes: 2 and 7.
"So, which central tendency measure should I use?" Well, the mean is often used when there isn't a number in the data set that's significantly different. The median, on the other hand, is used when there is a number that's significantly different. And the mode? The mode is used when people need to find a common number to represent a data set!
If you have any questions, feel free to contact us via the contact box in our blog.


Comments